Playwright Flaky Test Debugging in VS Code
Written by Kajal · Reviewed and published by Prasandeep
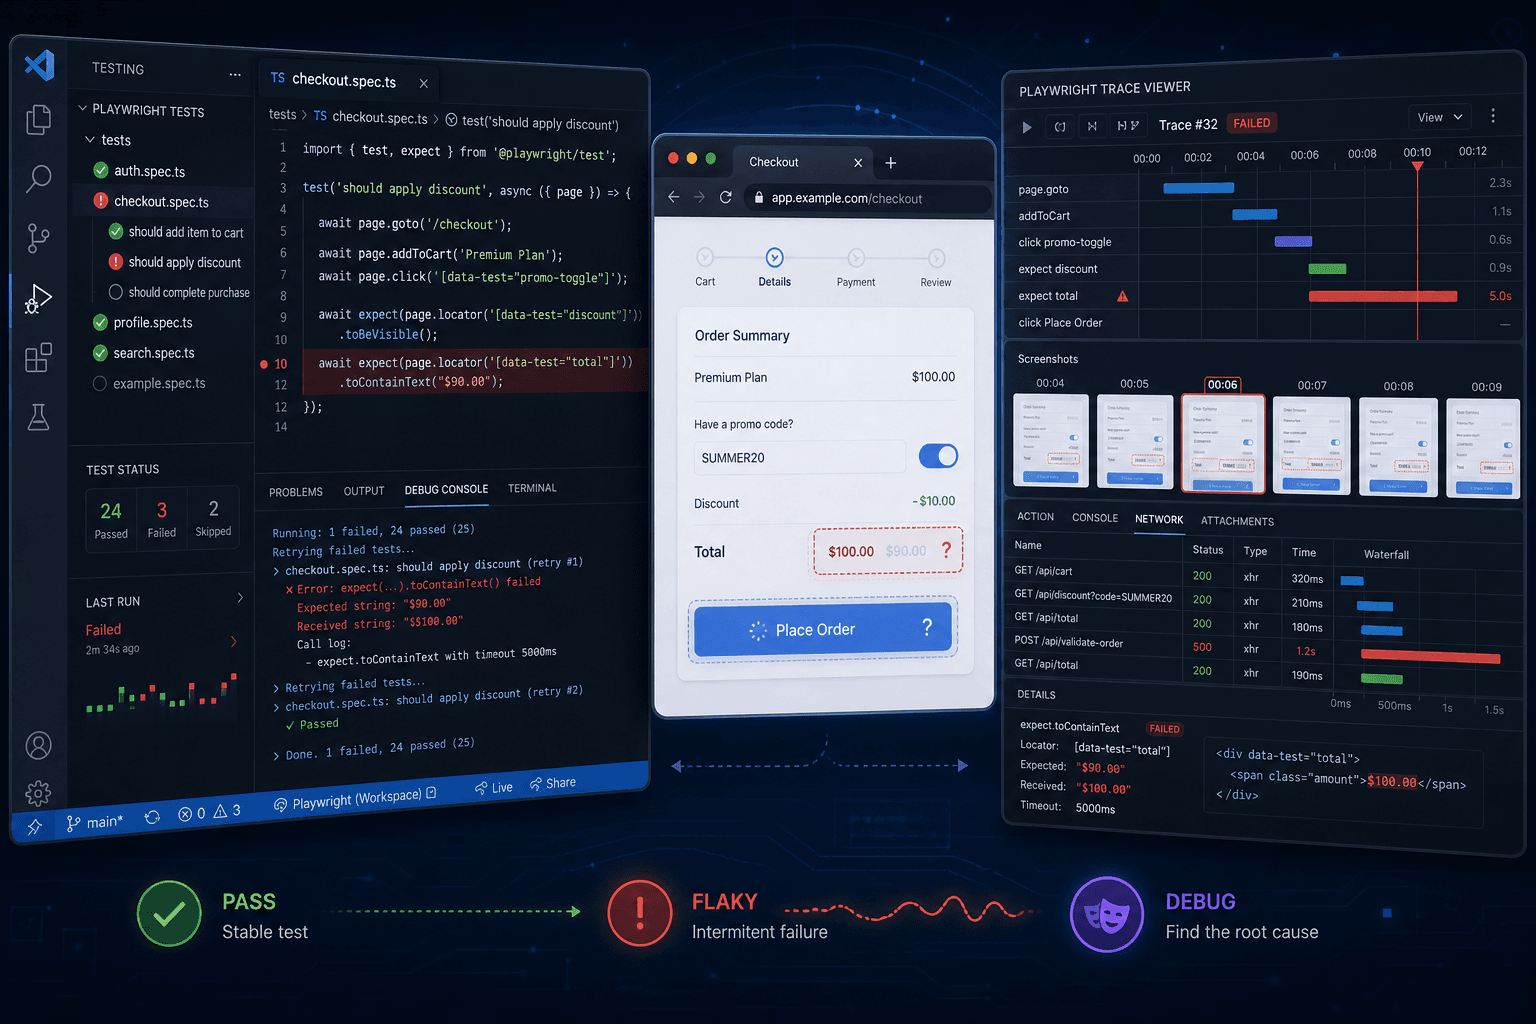
Playwright is strong for end-to-end testing: real browsers, device emulation, and built-in traces, screenshots, and videos. The painful moment is when a test passes on your laptop and fails in CI—or passes nine times and fails on the tenth—with no code change. That is flakiness, and it slowly breaks trust in your pipeline.
This guide shows how to find, replay, and fix flaky Playwright tests inside VS Code, using the official Playwright Test for VS Code extension, the CLI, and the Trace Viewer. The flow is: reproduce under stress → capture artifacts → debug in the editor → harden the test.
For framework-level context, see Playwright vs Selenium vs Cypress: 2026 Comparison. For flaky tests beyond Playwright, see Fix Flaky Tests: 2026 Masterclass. For where E2E sits in your portfolio, see Modern Test Pyramid 2026: Complete Strategy.
What “flaky” means in Playwright
A flaky test passes on some runs and fails on others while your app commit and test code stay the same. In Playwright you often see:
- A locator (the way the test finds an element) matches sometimes and not others.
- A timing gap: the button is clickable, but the server has not finished saving yet.
- Shared state: two tests use the same login, database row, or browser storage and step on each other.
When red builds feel random, teams start ignoring failures. The goal of debugging is to turn “maybe a bug” back into “red means something broke.”
Tools you will use
| Tool | What it does for flaky tests |
|---|---|
| Playwright Test for VS Code | Run and debug tests from the editor; see pass/fail inline; open reports. |
| Playwright CLI | Stress runs: --repeat-each, --workers, -x, --retries 0, --debug. |
| Trace Viewer | Replay the full run: DOM snapshots, network, console, timing. |
| Web-first assertions | expect(locator).toBeVisible() retries until timeout instead of one-shot checks. |
Together: repeat until it fails → open trace → fix locator or wait → stress again.
Setup: Playwright + VS Code
This guide assumes Node.js and @playwright/test with TypeScript.
Install the project and extension
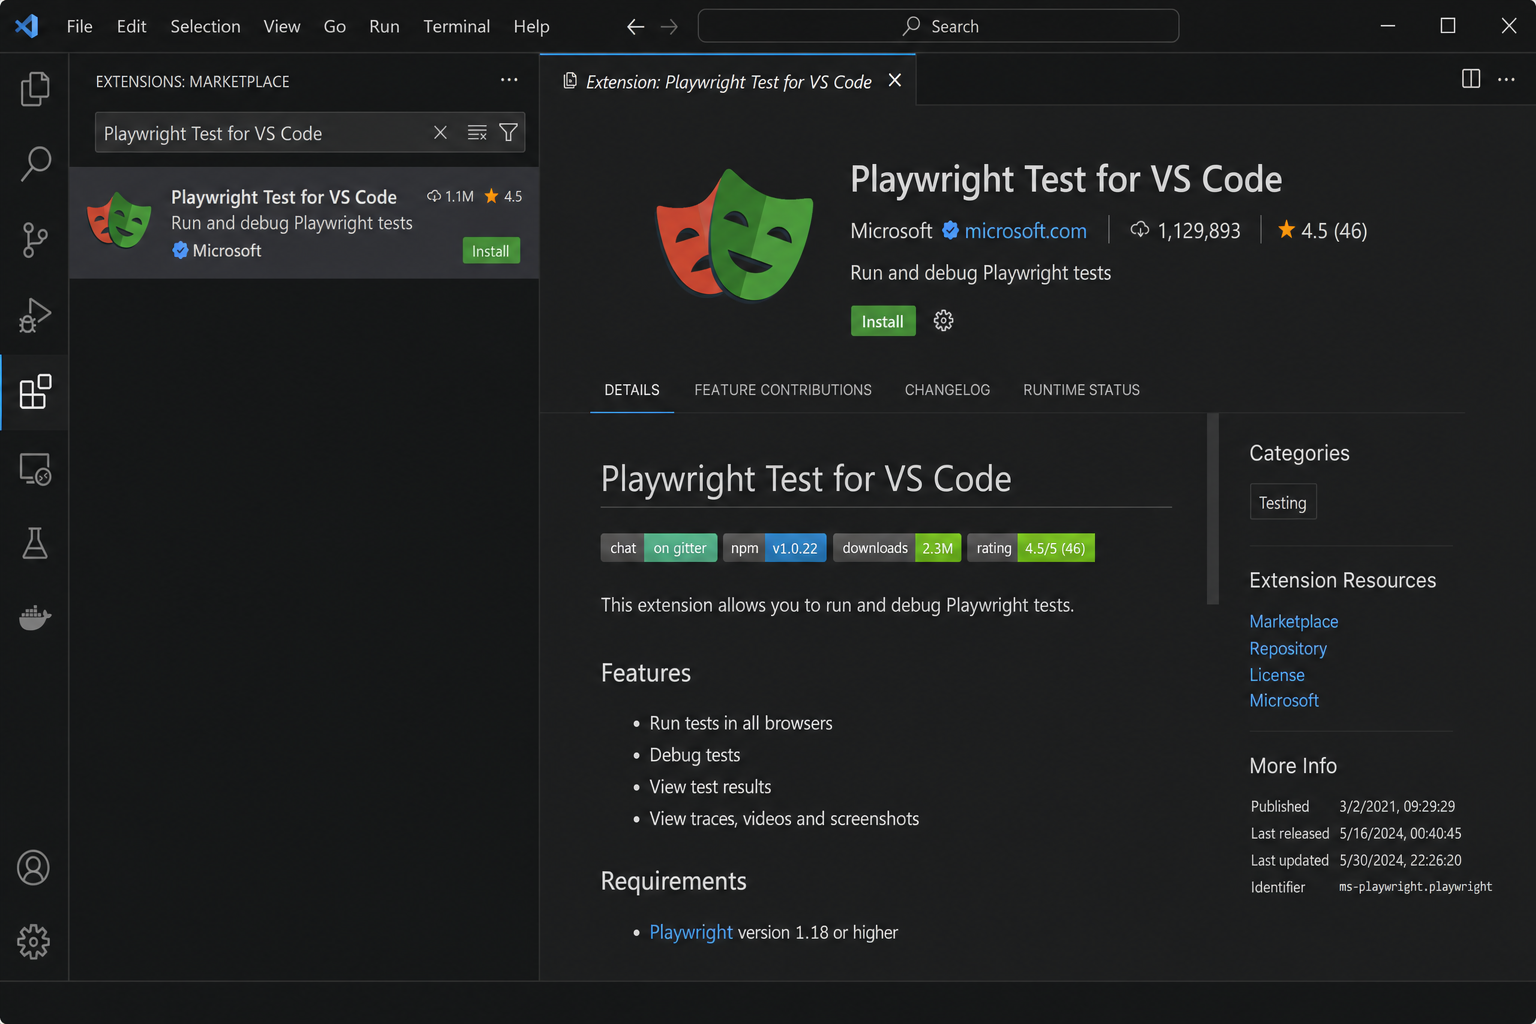
npm init playwright@latestPick TypeScript when prompted. Open the folder in VS Code, then install Playwright Test for VS Code from Extensions (Ctrl+Shift+X / Cmd+Shift+X). The extension finds playwright.config.ts and lists tests in the Testing sidebar.
The screenshot below shows the Extensions view with Playwright Test for VS Code ready to install.
Official docs: Getting started, VS Code integration.
Turn on diagnostics in playwright.config.ts
Capture enough data on failure without filling your disk on every green run:
import { defineConfig } from "@playwright/test";

export default defineConfig({
  timeout: 30_000,
  globalTimeout: 60_000,
  use: {
    screenshot: "only-on-failure",
    video: "retain-on-failure",
    // Record a trace when a test fails once and Playwright retries
    trace: "on-first-retry",
  },
  // Use retries in CI after debugging; see below for local stress runs
  retries: process.env.CI ? 2 : 0,
});
trace: 'on-first-retry' is useful for flakes: the first attempt fails, Playwright retries, and you get a trace from that retry path. While hunting the root cause, run with --retries 0 so retries do not hide the failure.
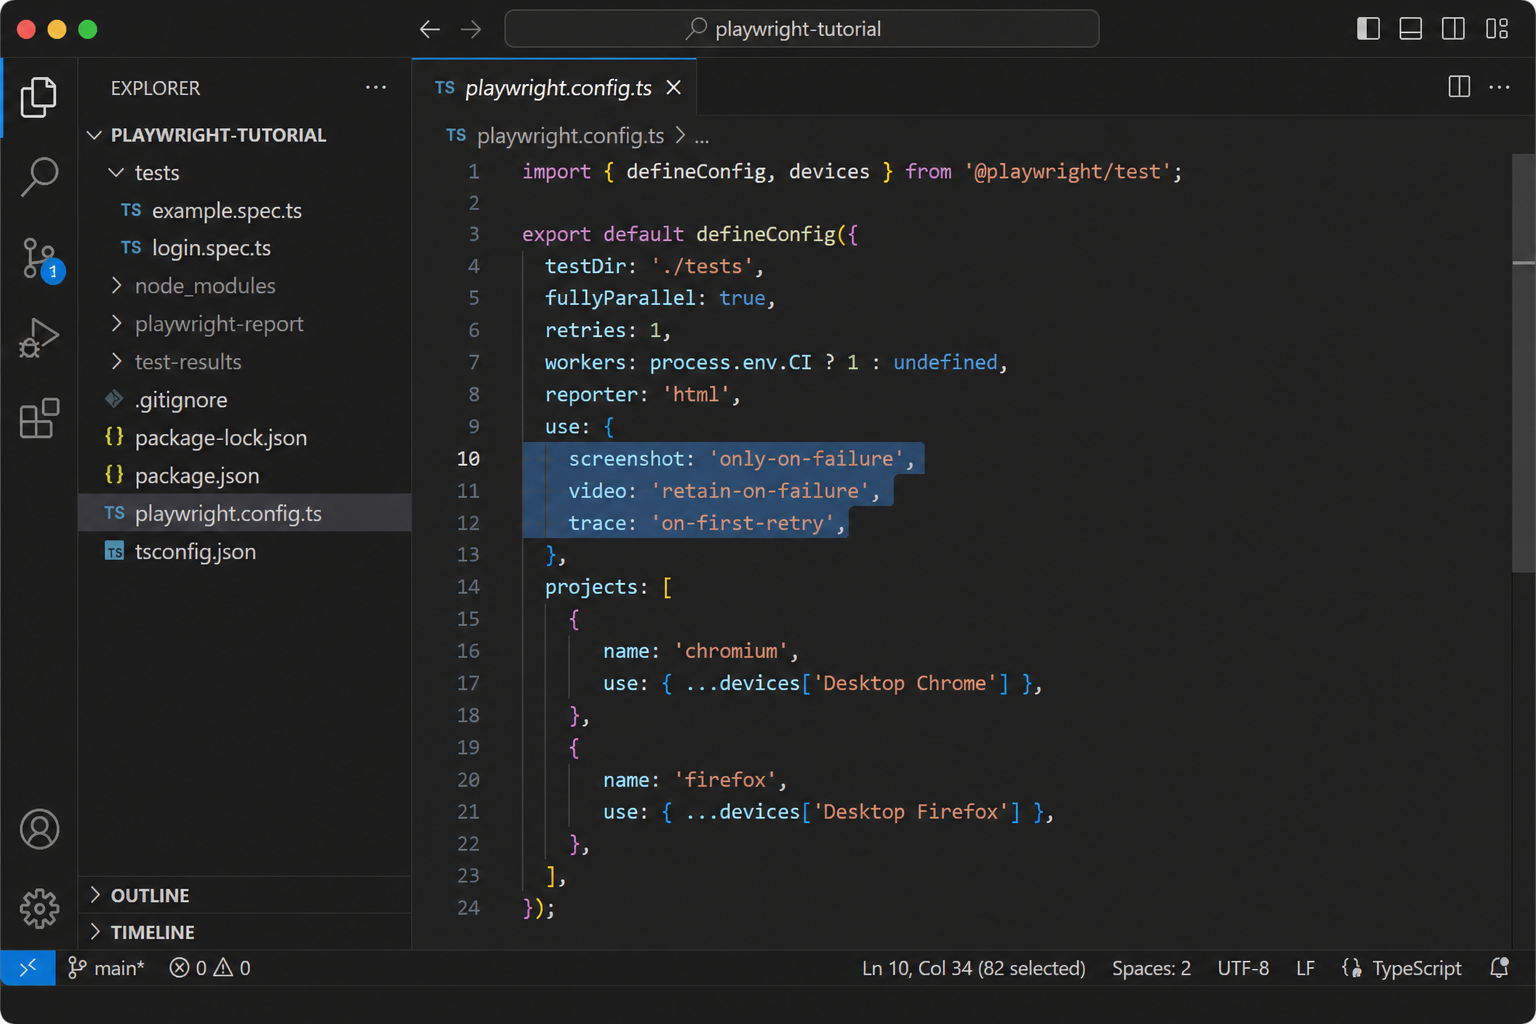
The screenshot below shows playwright.config.ts with screenshot, video, and trace options set for failure debugging.
Other trace modes (docs): on, off, retain-on-failure, on-all-retries.
Step 1 — Reproduce flakiness locally (before VS Code debug)
You cannot fix what you cannot repeat. Mimic CI: more runs, more parallelism, no silent retries.
Turn off retries while debugging
Retries can make a flaky test look green on the second try:
npx playwright test --retries 0Or set retries: 0 in config for local work only; turn retries back on in CI after the test is stable.
Run the same test many times (--repeat-each)
# Whole file, 10 times
npx playwright test login.spec.ts --repeat-each 10 --retries 0

# One test by line number (check your file)
npx playwright test login.spec.ts:20 --repeat-each 100 --retries 0
If failures show up only after many runs, you have a real flake—not a one-off glitch.
Add pressure with workers
Some bugs appear only when the CPU is busy (like a shared CI runner):
npx playwright test --repeat-each 100 --workers 10 --retries 0Each worker runs tests in parallel in separate browser contexts. That can expose race conditions or shared resource issues.
Stop on first failure (-x)
npx playwright test --repeat-each 100 --workers 10 -x --retries 0-x stops the run at the first failure so you can open the report and trace immediately.
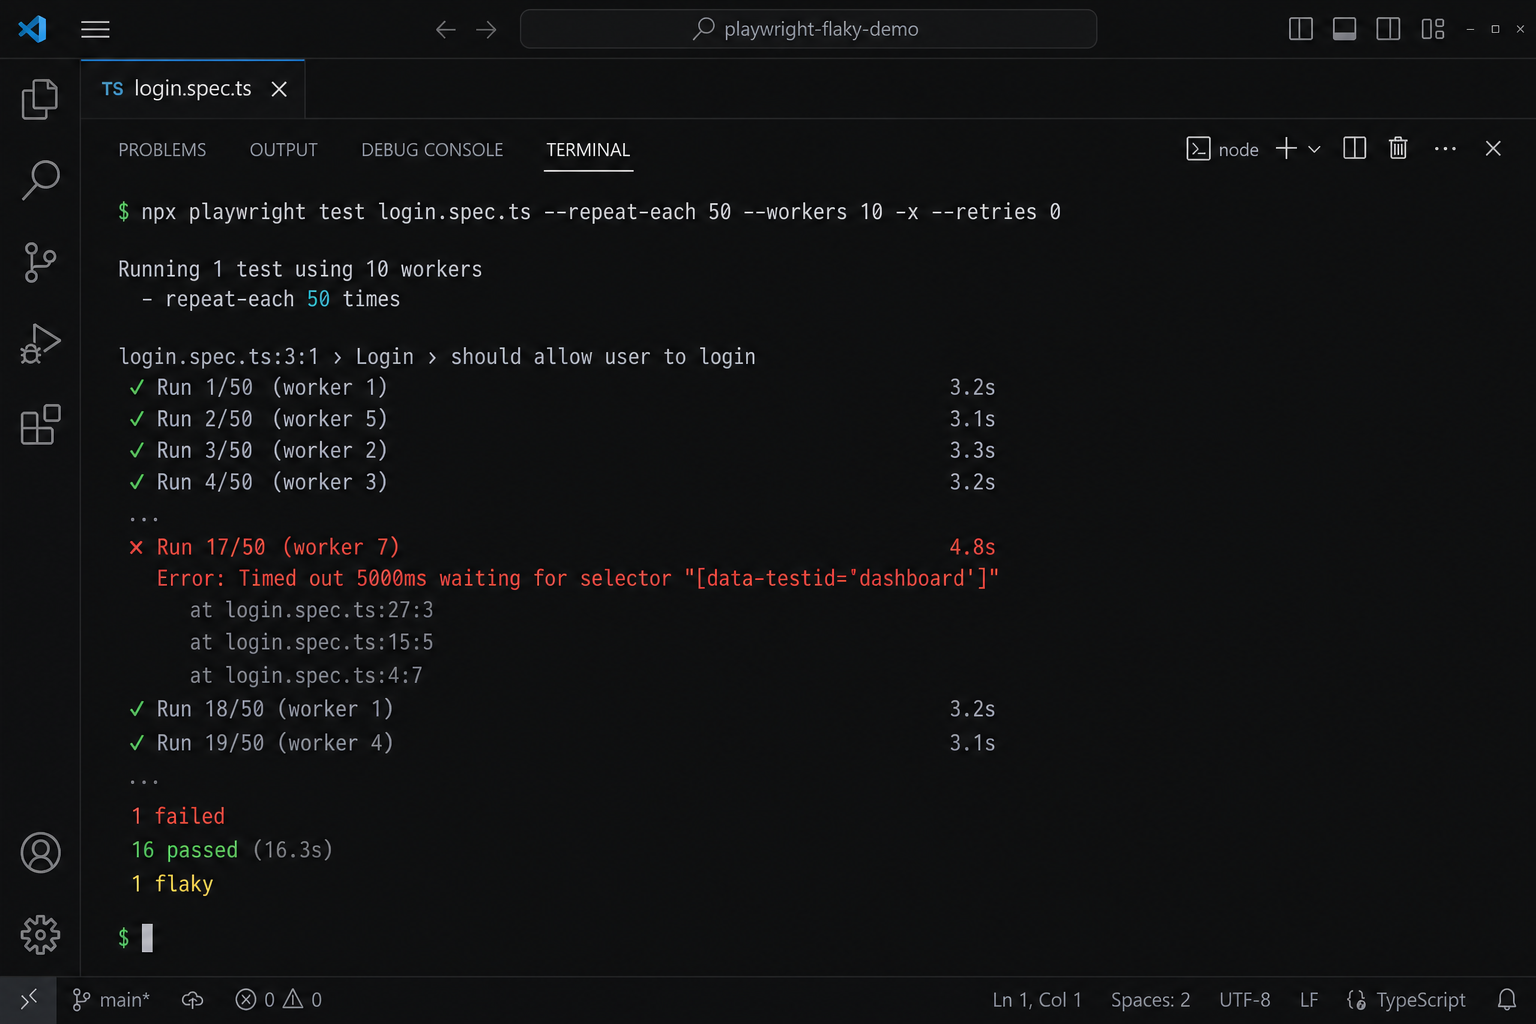
The screenshot below shows a stress run in the VS Code terminal: --repeat-each and --workers in the command, with output from many runs until a failure appears.
Step 2 — Debug in VS Code
Once you have a failing run, use the editor.
After the extension is installed, your specs appear in the Testing sidebar—this is where you run, debug, and open reports day to day.
The next screenshot shows the Testing sidebar with your spec files, pass/fail icons, and Run / Debug actions on each test.
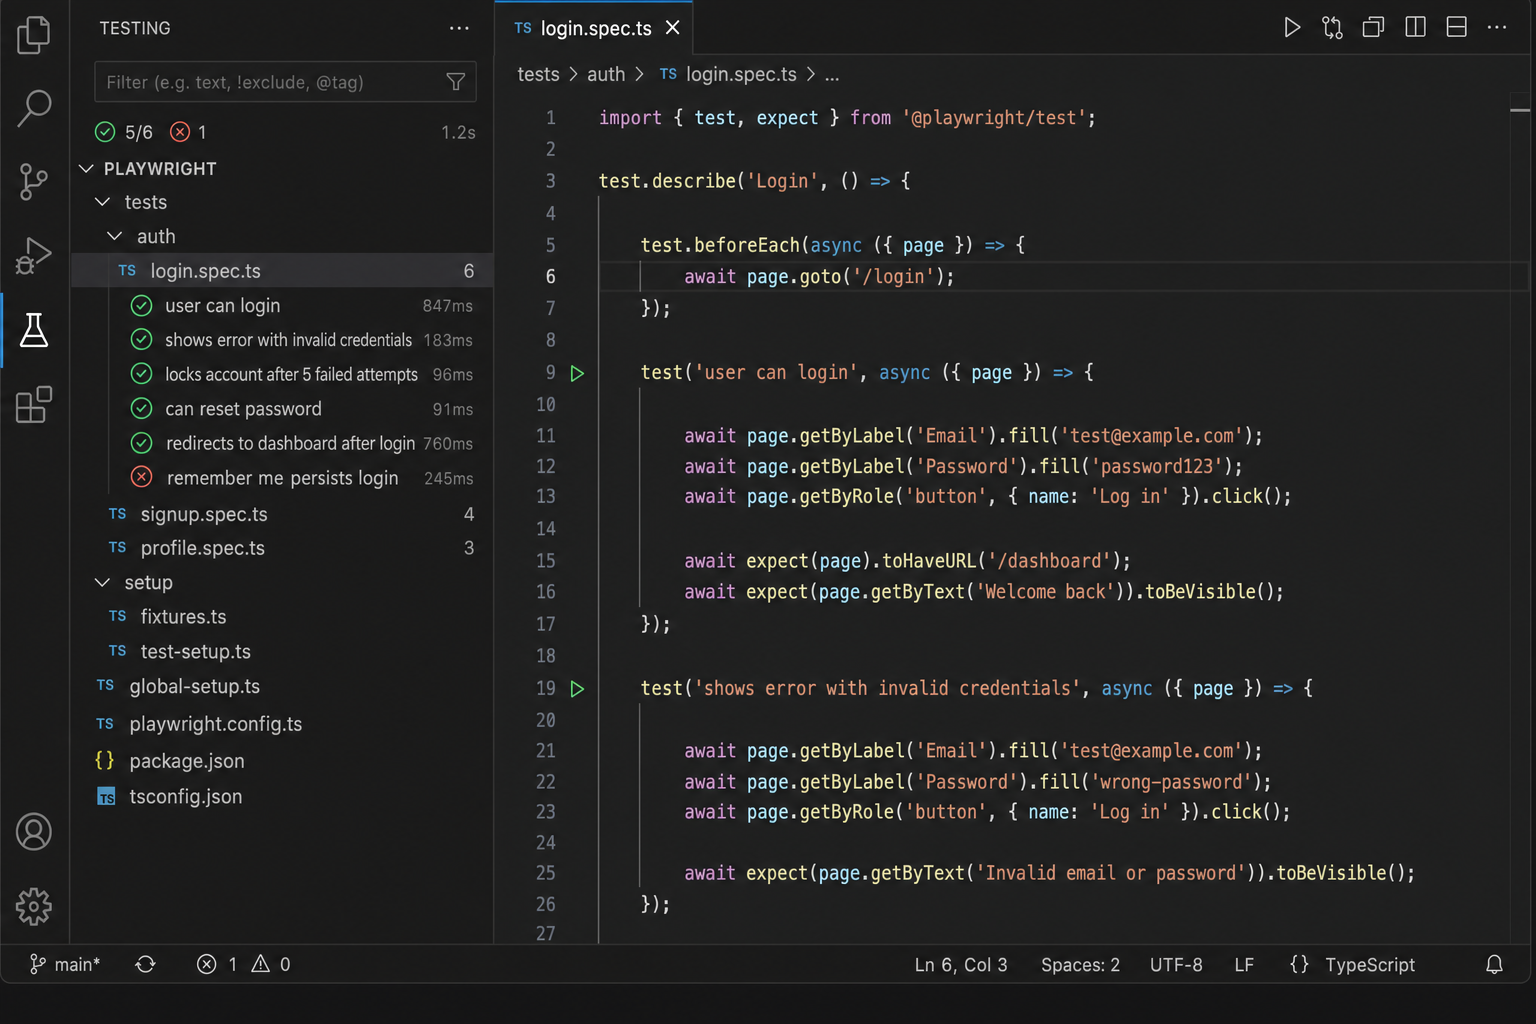
Run tests and read failures inline
After the extension is installed:
- Green / red icons appear next to tests in the file.
- Click Run (▶) next to a test, or right-click → Run test.
- On failure, expand the test in the Testing view for the error line and message.
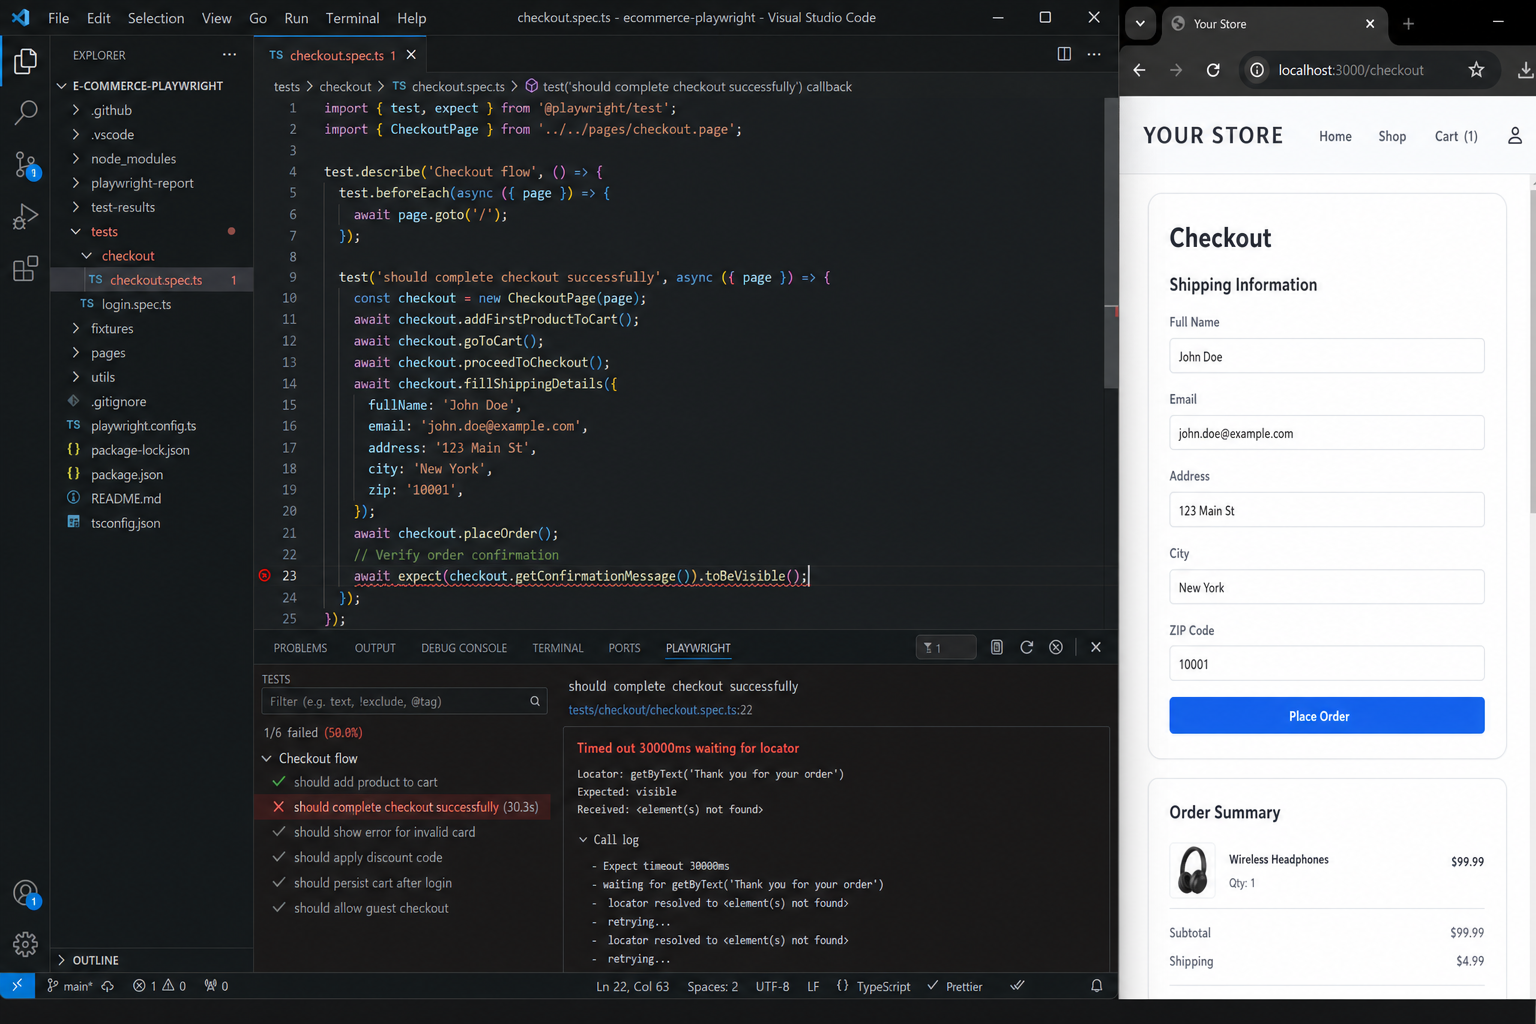
The screenshot below shows a failed run in VS Code: red icon on the test, the error message in the Testing panel, and the line where the assertion timed out.
Breakpoints (step-through debugging)
- Open
login.spec.ts(or your spec). - Click the gutter to set a breakpoint on a line inside the test.
- Right-click the test → Debug test (or use the debug icon).
Playwright opens a browser, pauses at the breakpoint, and you can use F10 (step over) and F11 (step into). In the debug console, inspect:
await page.url();
await page.title();
await page.getByRole("button", { name: "Save" }).count();
Use this when you need to see exactly what the page looked like at a line—not only the final assertion error.
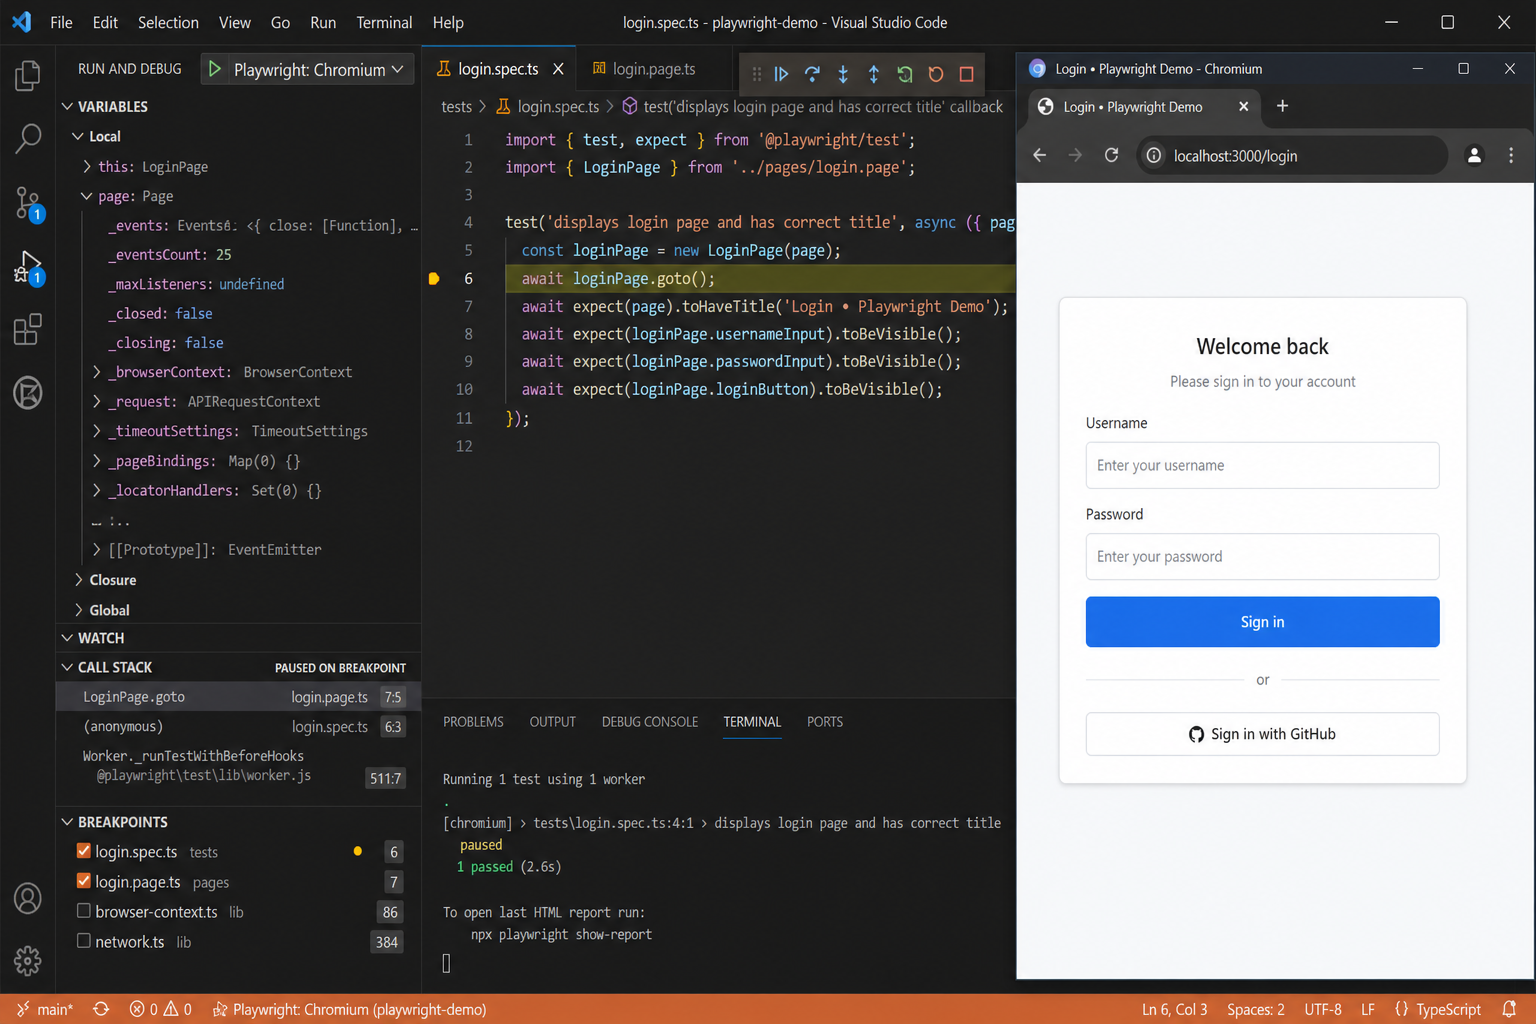
The next screenshot shows Debug test paused on a breakpoint: the yellow gutter marker, debug toolbar, Variables panel, and the browser stopped on the page under test.
Debug mode and locator highlighting
Debug test runs with Playwright’s debug tooling (similar to the older standalone inspector). You can:
- Pause on actions.
- Hover locators in the editor to highlight matching elements in the browser (locators guide).
For timing bugs, combine debug with a trace from a failed stress run.
Pick Locator (fix brittle selectors)
Weak selectors are a top cause of flakes. In the Testing sidebar, use Pick locator (wording may vary slightly by extension version):
- Browser opens; click the target element.
- VS Code shows options:
getByRole,getByTestId,getByText, etc. - Prefer role + accessible name or
data-testidover long CSS paths.
// Prefer
await page.getByRole("button", { name: "Submit" }).click();
await page.getByTestId("submit-button").click();

// Avoid when possible
await page.locator("div.container > button.btn-primary").click();
Re-run with --repeat-each after changing locators.
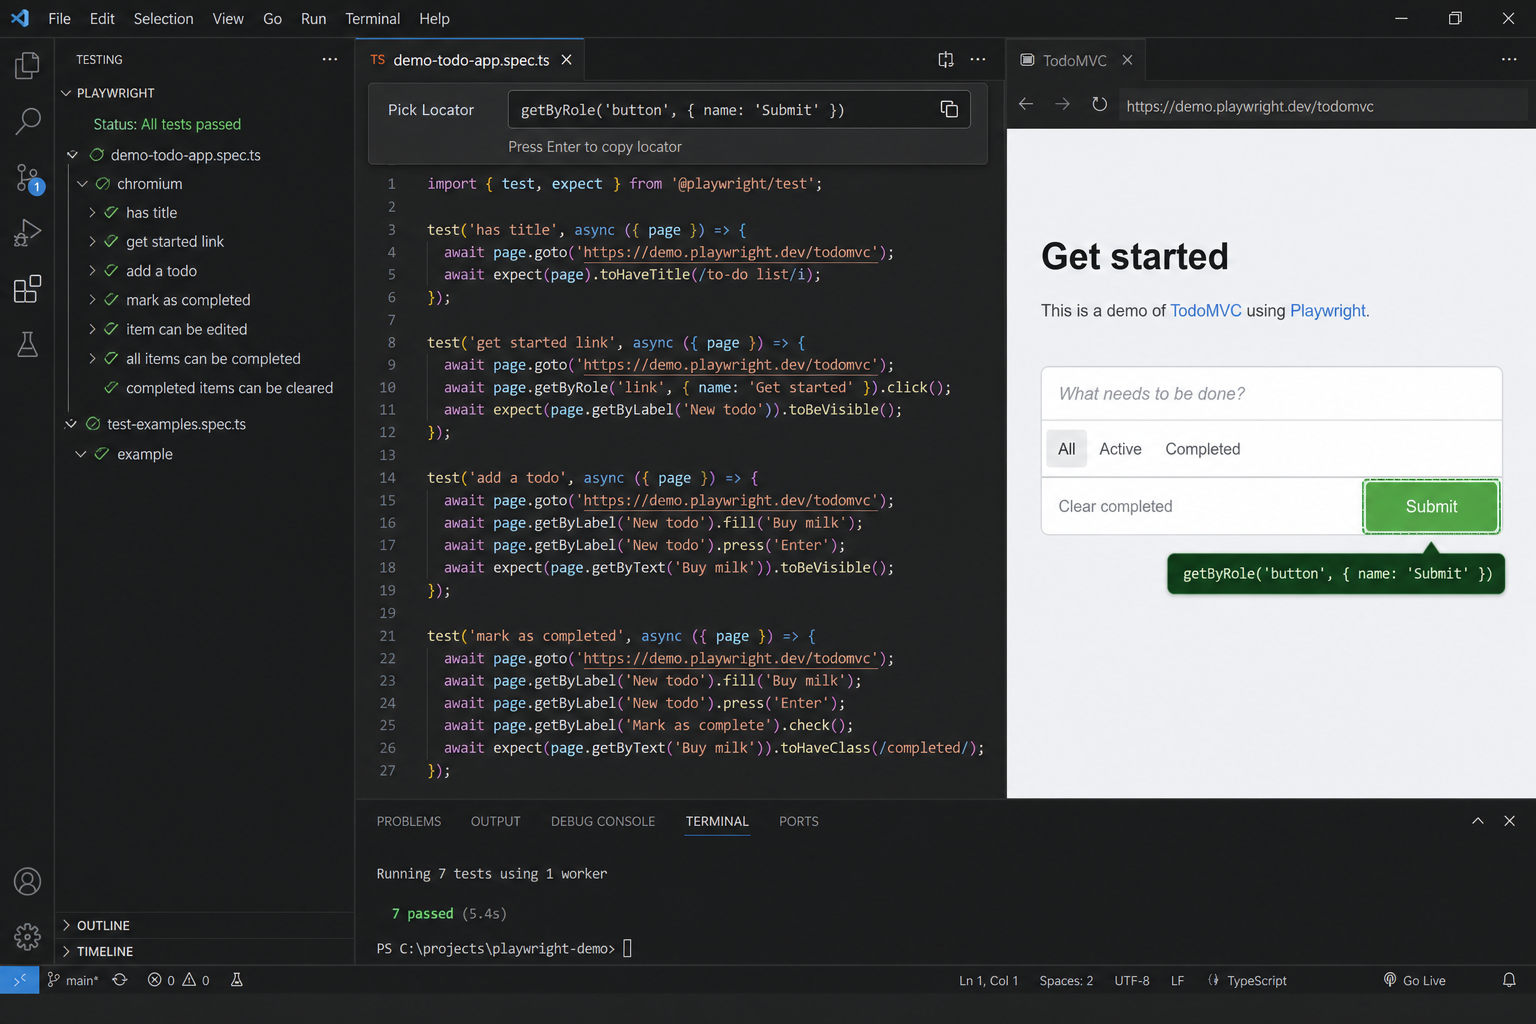
The next screenshot shows Pick locator: the locator bar with a suggested getByRole(...) and the matching element highlighted in the browser.
Step 3 — Trace Viewer (replay the failure)
The Trace Viewer is a timeline of actions, DOM, network, and console logs.
Open a trace from VS Code
- Run a failing test (with
trace: 'on-first-retry'ortrace: 'on'for local debugging). - Open the HTML report: Show report in the Testing sidebar, or:
npx playwright show-report- On the failed test, open Trace (or click the
trace.zipattachment).
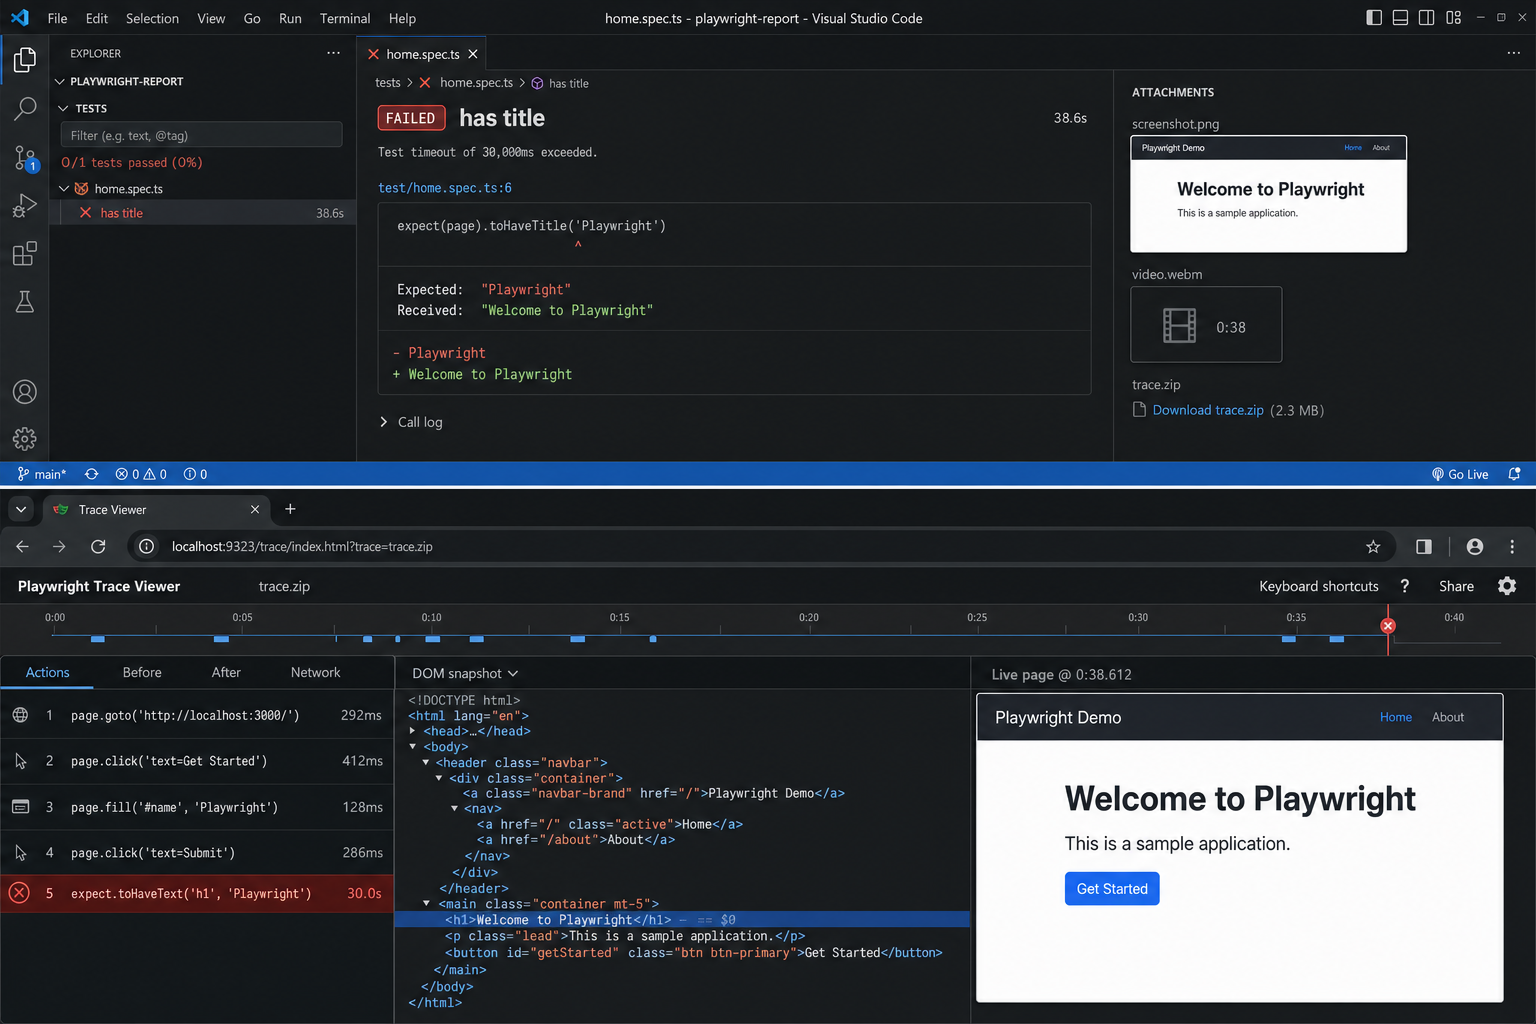
Top half of the screenshot below — the HTML report in VS Code: which test failed, the Expected vs Received diff, and Attachments (screenshot, video, trace file).
Bottom half — the Trace Viewer after you open that trace: the timeline, the Actions list with the failing step in red, the DOM at that moment, and a screenshot of the page when the assertion broke.
What to look for
- Timeline: Did the failure happen on click, navigation, or assert?
- DOM snapshots: Was the element missing, covered, or off-screen?
- Network: Did the API return before your assertion ran?
- Console: Any client-side errors right before the fail?
Questions a trace answers:
- Did the element flash visible then disappear?
- Did we assert before the save API finished?
- Did another test or tab change shared storage?
Fix by waiting for the right signal (see below), not by increasing timeout everywhere.
Common root causes (and fixes)
1. Timing: UI ready ≠ business logic done
Playwright auto-waits until an element is actionable, but it does not know your backend finished.
await page.getByRole("button", { name: "Save" }).click();
await expect(page.getByText("Changes saved")).toBeVisible();
The button may click while the save API is still in flight.
Fix — web-first assertion with timeout:
await expect(page.getByText("Changes saved")).toBeVisible({ timeout: 10_000 });Fix — wait for the network response:
await page.getByRole("button", { name: "Save" }).click();
await page.waitForResponse(
  (res) => res.url().includes("/api/save") && res.status() === 200
);
await expect(page.getByText("Changes saved")).toBeVisible();
See auto-waiting and test assertions.
2. Brittle locators
Avoid locators tied to random IDs, order numbers in text, or CSS classes that designers change every sprint. Use locator best practices: roles, labels, test ids.
3. Shared state between tests
Playwright gives each test a fresh browser context by default. Flakes still happen if you:
- Reuse one logged-in
storageStatewithout resetting data. - Share database rows or files between tests.
- Mutate global config in
beforeAllwithout cleanup.
Fix:
- Unique test data per run (
user-${Date.now()}@example.com). test.afterEachto delete records or reset flags.- Avoid depending on test execution order.
4. Slow or unstable external services
Third-party auth, payment, or email APIs cause intermittent reds.
Fix:
- Route and mock non-critical APIs with
page.route()(network mocking). - Stub in CI; hit real services only in a smaller contract suite.
- Log slow calls; raise timeout only for calls you truly cannot mock.
await page.route("**/third-party/analytics", (route) => route.fulfill({ status: 200, body: "{}" }));Advanced: simulate slow CI with CPU throttling (CDP)
Tests that pass on a fast laptop may fail on a slower CI VM. You can slow down the browser CPU locally with the Chrome DevTools Protocol (CDP)—the same protocol Playwright uses under the hood.
import { test } from "@playwright/test";

test.beforeEach(async ({ page }) => {
  const session = await page.context().newCDPSession(page);
  await session.send("Emulation.setCPUThrottlingRate", { rate: 5 });
});
rate: 5 means roughly 5× slower CPU (tune for your machine). Then stress:
npx playwright test flaky.spec.ts --repeat-each 30 --workers 5 -x --retries 0When it fails, debug in VS Code with breakpoints and traces.
Warning: Use this only locally for reproduction. Do not commit CPU throttling to shared CI config unless the whole team agrees.
Optional: repeat tests from VS Code
Community extensions such as Playwright Test Repeater add Run 3× / 10× buttons next to tests in the editor. Workflow:
- Install from the VS Code Marketplace.
- Run a suspicious test 10× without leaving the IDE.
- On failure, open Debug test or the trace from the report.
The CLI flags above do the same thing; extensions are optional sugar.
Flakes on one browser or mobile only
Configure projects per browser (projects docs):
import { defineConfig, devices } from "@playwright/test";

export default defineConfig({
  projects: [
    { name: "chromium", use: { ...devices["Desktop Chrome"] } },
    { name: "firefox", use: { ...devices["Desktop Firefox"] } },
    { name: "webkit", use: { ...devices["Desktop Safari"] } },
    { name: "mobile", use: { ...devices["Pixel 5"] } },
  ],
});
Stress one engine:
npx playwright test checkout.spec.ts --project=firefox --repeat-each 20 --retries 0In VS Code, pick the project in the test runner, then debug with breakpoints and traces. Mobile-only flakes often come from viewport, touch vs click, or elements hidden by layout.
Stabilize tests after you find the bug
Use web-first assertions (not one-shot checks)
Avoid:
if (await page.getByText("Success").isVisible()) {
  // ...
}
Prefer:
await expect(page.getByText("Success")).toBeVisible();expect polls until the condition is true or the timeout hits (assertions).
Isolate data and environment
- One user or order id per test.
- Pin timezone/locale if the app is date-sensitive (
timezoneIdin config). - In CI, fix worker count and document why (see parallelism).
Retries: band-aid vs policy
Retries in CI can keep the pipeline moving while you fix root causes—but they also hide flakes. Track retry count per test; any test that often passes only on retry should be quarantined and fixed. See Fix Flaky Tests: 2026 Masterclass for team policy ideas.
Quick workflow (cheat sheet)
1. npx playwright test path/to/spec.ts --repeat-each 50 --workers 8 -x --retries 0
2. npx playwright show-report  → open Trace on failure
3. VS Code: Debug test + Pick Locator on the failing step
4. Fix: stable locator + wait for API/UI signal (expect / waitForResponse)
5. Re-run step 1 until stable
6. Re-enable CI retries only if policy allows; monitor flake rate
Bottom line
Flaky Playwright tests are debuggable when you stress them on purpose, record traces, and debug in VS Code instead of re-running the whole suite and hoping. Most fixes are boring and good: better locators, wait for the right outcome, unique test data, and mocked externals.
Next steps: pick one red-or-orange test in your repo, run --repeat-each 30 --retries 0, open the trace, and fix one root cause this week. Your future self (and your CI bill) will thank you.
Further reading: Playwright debugging guide, CI best practices, trace viewer.